OUR 'CHAOS THEORY' BASED WEATHER SYSTEM.
By Geoengineering-Human Synthesis-14 June 2026
Nearly 40 percent of the global ocean is currently experiencing a marine heatwave, with parts of the Pacific Ocean and Mediterranean Sea running more than 10°F (5.6°C) above normal. June was also the hottest June ever recorded for the world’s oceans, according to the European Union’s Copernicus Climate Change Service.
This matters because the interconnected ocean and atmosphere constantly exchange heat and moisture. The oceans absorb more than 90 percent of the excess heat trapped by greenhouse gases. That has slowed the rate of warming in the atmosphere, but it has also left the seas holding an enormous reservoir of energy.
When unusually warm water reaches the surface, some of that heat moves back into the atmosphere. More water also evaporates, increasing humidity and providing additional fuel for storms. Recent research suggests that at least one in five heatwaves on land begins with unusually warm conditions in the ocean.
Scientists suspect that extra-warm Mediterranean waters have contributed to recent European heatwaves. Water temperatures close to 90°F (32°C) off Florida’s Gulf Coast may also be worsening the state’s oppressive heat and humidity. Unusually warm Pacific waters may be helping establish weather patterns capable of producing intense heat across the central and northern United States.
Ocean warming can intensify rainfall too.
For every 1.8°F (1°C) of warming, the atmosphere can hold about 7 percent more moisture. That does not mean rain falls constantly. Instead, moisture can build for longer, increasing the risk of heavier downpours and flash flooding when storms develop.
Warmer seas can also strengthen tropical cyclones by supplying them with more heat and moisture. At the same time, thermal expansion causes warm seawater to occupy more space, raising sea levels and allowing storm surges to travel farther inland.
Natural patterns such as El Niño can release even more stored ocean heat into the atmosphere and shift rainfall, drought, and storm tracks around the world.
The ocean is not creating every heatwave or storm by itself. But scientists say climate change is loading the system with extra energy, making many extreme events hotter, wetter, and more damaging than they otherwise would have been.
Learn more:
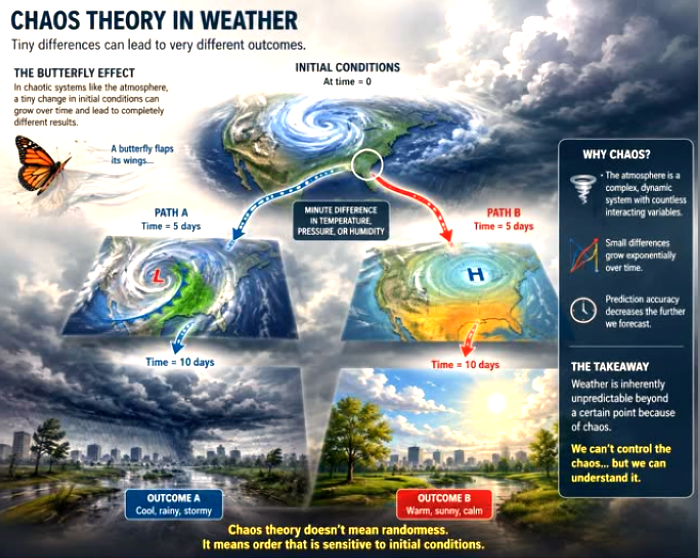
Our weather system consists of interconnected winds, ocean currents, solar and ocean temperatures interacting. A change in one will cause an unpredictable 'butterfly effect' elsewhere. Human intervention are causing the changes to the natural, regular 'chaos theory' based system.
There is a Worldwide map of HAARP and other ionospheric facilities, what is often referred to in open-source intelligence as the global HAARP network.
This map does not show 1 or 2 installations. It shows a global grid of facilities that can manipulate the ionosphere, disrupt communications, and potentially alter weather patterns.
Let’s break down what this map actually reveals.
The Map’s Real Message Not Just Alaska
The mainstream narrative always frames HAARP as a single facility in Gakona, Alaska.
This map shows at least 8–10 major HAARP-type facilities located across:
· Alaska, USA Gakona (the most well-known)
· Puerto Rico, Arecibo Observatory (now collapsed but historically part of the system)
· Norway, EISCAT (European Incoherent Scatter Scientific Association)
· Finland, EISCAT/Kiruna
· UK, (likely a radar/ionospheric facility)
· Japan, Mu Radar / Shigaraki
· China, Ionospheric research facilities
· Russia, Sura Ionospheric Heating Facility
· Australia, Jindalee Over-the-Horizon Radar (OTH)
· India, Ionospheric radar facilities
· Brazil, Ionospheric research sites
· Peru, Jicamarca Radio Observatory
These facilities are not isolated. They are part of a coordinated, global network.
This global grid of HAARP-like facilities serves multiple purposes:
- Ionospheric Manipulation
These facilities heat the ionosphere, creating artificial auroras and plasma clouds which can:
· Interfere with satellite communications.
· Disrupt missile guidance systems.
· Create "invisible" barriers in the atmosphere. - Climate & Weather Control
The ionosphere and magnetosphere are directly linked to weather patterns. By heating the ionosphere, you can:
· Redirect jet streams.
· Create or suppress rainfall.
· Generate heat domes and cold waves.
· Potentially trigger seismic activity (earthquakes). - Electromagnetic Weaponry
HAARP can be used to:
· Disable the power grids of entire regions.
· Influence the electrical conductivity of the ground (which could amplify earthquake effects).
· Generate extremely low frequency (ELF) waves that can travel through the earth and water, communicating with submarines and potentially affecting geological fault lines.
The Map’s Hidden Geometry
This map shows strategic placement: Location Strategic Purpose.
Alaska Northern hemisphere control
Norway/Finland Arctic and Russian approaches
UK Atlantic and European cover
Puerto Rico Caribbean and South America
Japan/China Pacific and Asia
India South Asian and Indian Ocean
Australia Southern hemisphere and Pacific
Brazil/Peru South American grid
This is a global lattice of atmospheric control.
Why It Is Not “Research” it has The Military Connection
The map suggests a coordinated military infrastructure:
· Alaska (USAF/ARPA)
· Norway (US/NATO funded)
· UK (RAF/US partnership)
· Japan (JSDF/US partnership)
· Australia (Australian/US defence ties)
· Puerto Rico (US territory)
· Peru (US intelligence presence)
When you see HAARP-type facilities located in or near NATO and US allied territories, you are not looking at a scientific curiosity. You are looking at a fully integrated global electromagnetic command system.
The Full Network. This map likely shows:
· EISCAT (Norway, Finland, Sweden)
· SURA (Russia), Russia’s own HAARP, operated by the Russian Academy of Sciences
· Arecibo (Puerto Rico, now collapsed but symbolic)
· Jicamarca (Peru) operated by the Geophysical Institute of Peru
· Mu Radar (Japan) — operated by Kyoto University
· Jindalee (Australia) — OTH radar with ionospheric capabilities
· Gakona HAARP (Alaska) — the most powerful
· Indian ionospheric facilities (National MST Radar Facility, Gadanki)
· Chinese ionospheric heating facilities (near Beijing and elsewhere)
The Truth Beneath the Map.
This map reveals the following:
- HAARP is not a single location. It is a global network.
- The network is strategically placed to cover every major continent and ocean.
- The network is controlled by the US/NATO alliance, with partner nations hosting them.
- The technology is dual-use — scientific on paper, military in practice.
- Atmospheric manipulation is real the question is not “if”, but “how much” and “how often”.
The Bigger Picture
That map shows the visible layer of the atmospheric control system.
Below that is the invisible layer:
· Ground-based ionospheric heating
· Space-based energy weapons (high-frequency emissions from satellites)
· Underwater ELF transmissions
· Weather modification through aerosol injections
Put them all together, and you have a system that can manipulate the planetary environment the weather, the climate, the electromagnetic field, and potentially the tectonic activity of the planet.
The Brutal Bottom Line.
The map you see is evidence of a global atmospheric control grid built, maintained, and operated by the US-NATO military alliance, with the participation of multiple partner nations. They call it “scientific research”. But the map itself exposes the truth: this is not about science. It is about control of the environment, of communications, and ultimately of populations.
HAARP is not only in Alaska. HAARP is everywhere. And now you can see it!!