The shock graph that PROVES a huge stock market crash is COMING/amp
HUMAN SYNTHESIS
email: humansynthesis0@gmail.com
RECESSION WARNING: The shock graph that PROVES a huge stock market crash is COMING
STOCK markets across the world are on the edge of a devastating crash which could trigger a new economic meltdown, according to a key technical indicator.
DAILY EXPRESS - By LANA CLEMENTS
PUBLISHED: 11:23, Wed, Jul 5, 2017 |
In a flashing red warning, share valuations have soared to their second-highest ever level, suggesting that many stock investments are over-bought and could be in bubble territory.
The chart shows the world is on the brink of recession - GETTY
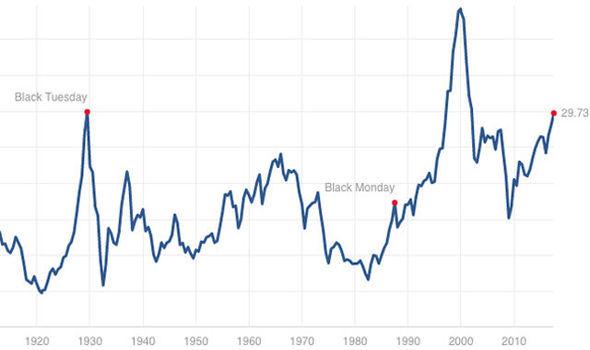
The only other time indicators were at this level was before the dot com crash at the turn of the millennium. Experts are now worried that history is about to repeat itself. It comes after stock markets in both the US and Britain have continually topped their highest ever levels in recent months.
American's top stock indices the Dow Jones and S&P 500 are up a staggering 20 per cent and 16 per cent respectively over the past 12 months, while Britain's FTSE 100 has surged as much as 15 per cent over the past 12 months.
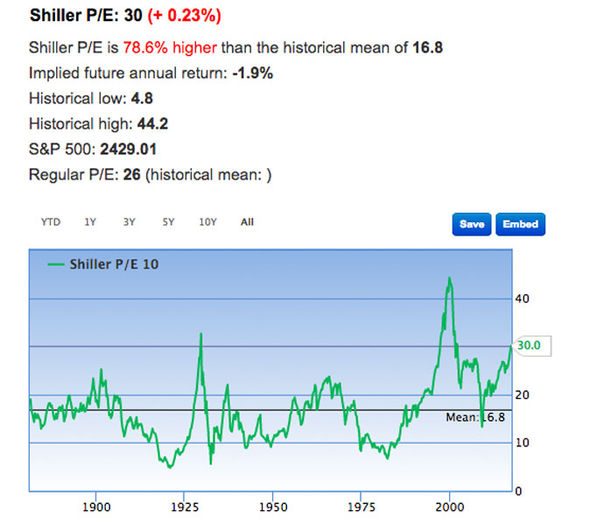
Shiller Price Earnings (PE) ratio graphMultpl.com
The Shiller Price Earnings (PE) ratio for the S&P 500 is at its highest level since 2000. If companies are in good health and profits are growing, soaring share prices may be justified. But one method of assessing share values, the Shiller PE (Price to Earnings) ratio on average inflation-adjusted earnings from the previous 10 years, suggests that stocks are very expensive.
In the below chart this level is at its highest since the Dot Com bubble burst in 2000 and stock markets crashed.
Stock market crash - GETTY
Another measure of stock health, also suggests the picture may not be as rosy as soaring indices suggest. Dividend cover for UK’s largest listed companies, a measure of how sustainable share payouts are, is at its lowest level since 2009, according to new analysis by The Share Centre.
The research shows companies have continued to increase dividends, keeping investors happy, but failed to grow profits at the bottom line. Nevertheless markets appear to remain positive - at least for now. This is largely because of the actions by central banks on both sides of the Atlantic.
Policymakers have pumped money into the economy through so-called Quantitative Easing and kept interest rates low, which has helped fuel stock market growth.
The worst stock market crashes in history
Wed, May 17, 2017
We have been witnesses to some of the worst stock market crashes ever known
Brexit aftermath: World markets tumbled and investors lost more than the equivalent of 2 trillion USD on 24 June 2016, making this day the worst single day drop in history according to data from S&P Global.
The Black Monday of 1987 refers to October 19, 1987 when stock markets around the world crashed, shedding a huge value in a very short time. The crash began in Hong Kong and spread west to Europe.
The economic effects arising from the September 11 attacks were initial shock causing global stock markets to drop sharply. The attacks themselves resulted in approximately $40 billion in insurance losses, making it one of the largest insured events ever 2015–16 Stock Market Selloff: Began in the US on August 18, 2015, when the Dow Jones Industrial Average fell 33 points and gathered downward momentum over several days, which became a steep selloff on August 21, 2015, falling 531 points (3.12%) on that 2015–16 Chinese stock market crash: The Chinese stock market turbulence began with the popping of the stock market bubble in June 2015 and ended in February 2016. A third of the value of A-shares on the Shanghai Stock Exchange was lost within one month. The August 2011 Stock Markets Fall was a sharp drop in stock prices in August 2011 in stock exchanges across the US, Middle East, Europe and Asia.
JH&P investment manager James Horniman said: “Price earnings ratios, though a crude measure of market valuations, are at the high end in many countries." However, monetary policy is still supportive of equities, the economic data coming through is better and we have seen positive earnings revisions, which should improve support for many stocks.
“Quantitative easing has pushed bonds into bubble territory and squeezed yields to levels that are unsustainable." That is driving investors into equities and further supporting equity markets.
“We do see pockets of irrational exuberance and the market failure to react to the general election result makes us concerned that they are becoming desensitised to political shocks, but we think this bull market has longer to run.”
WHO and WHAT is behind it all ? : >
Commentary:
Read: Adnan Sakli who single-handedly rescued the financial world in 2013:
February 14, 2013
Prime directive by Adnan Sakli and 8217

As the legal owner of record of the Bank of International Settlements I, Adnan SAKLI orders the immediate termination of all operations of illegal trades and complete shutdown of all operations in relations to the trades in any form or shape. All existing illegal liabilities of all the currencies must be met. In the even they are not met in accords of legal statutes of reporting and confirmation of the positions of the entire Global obligation then the entire operational positions of those nations and their currencies will have no position to be used as a means of exchange......
He was murdered in his hotel room in 2014
Death of a Legend in our time:
Administrator **HUMAN SYNTHESIS**